OTOBO | MAKE PEOPLE SMILE. IT’S EASY.

Dashboards und Reporting

Performance at a glance – in real time.

Dashboards and insightful reporting in OTOBO provide overview and data-driven decision-making. Visualize, analyze, and interpret the collected data to efficiently utilize your resources, optimize your service team’s performance, and enhance service quality.

DASHBOARDS AND REPORTING

Benefits

  • Clear presentation of metrics

    Dashboards provide a quick and clear presentation of important metrics, performance indicators, and current activities. As a team and decision-makers, you keep an eye on the status and performance of your service management at all times.

  • Real-time Information

    Based on real-time data, you respond quickly to current developments and events. This ensures faster problem resolution, decision-making, and service adaptation.

  • Identification of Trends and Patterns

    By analyzing data over an extended period, you can identify trends and patterns and take preventive measures to avoid potential issues.

  • Enhanced decision making

    Dashboards provide your decision-makers with the information they need to make informed decisions. They can prioritize and allocate resources more efficiently.

  • Customer-centric analysis

    In customer service, reports help analyze customer feedback and inquiries to identify trends and continuously improve service quality.

  • Customizable reports

    Tailor reports and dashboards to your team’s requirements and personalize their display. This way, your team receives information that is most relevant to their specific needs and roles.

  • Compliance and performance monitoring

    Utilize the dashboard to monitor compliance with Service Level Agreements (SLAs) and other compliance requirements. Keep an eye on performance and respond as needed to meet SLAs.

DASHBOARDS AND REPORTING

Capabilities

Gain real-time insights into service desk performance, customer satisfaction, and your service team’s efficiency. Generate meaningful reports and dashboards based on your ticket, process, and CMDB data – all without needing programming skills.

Dashboard – everything at a glance

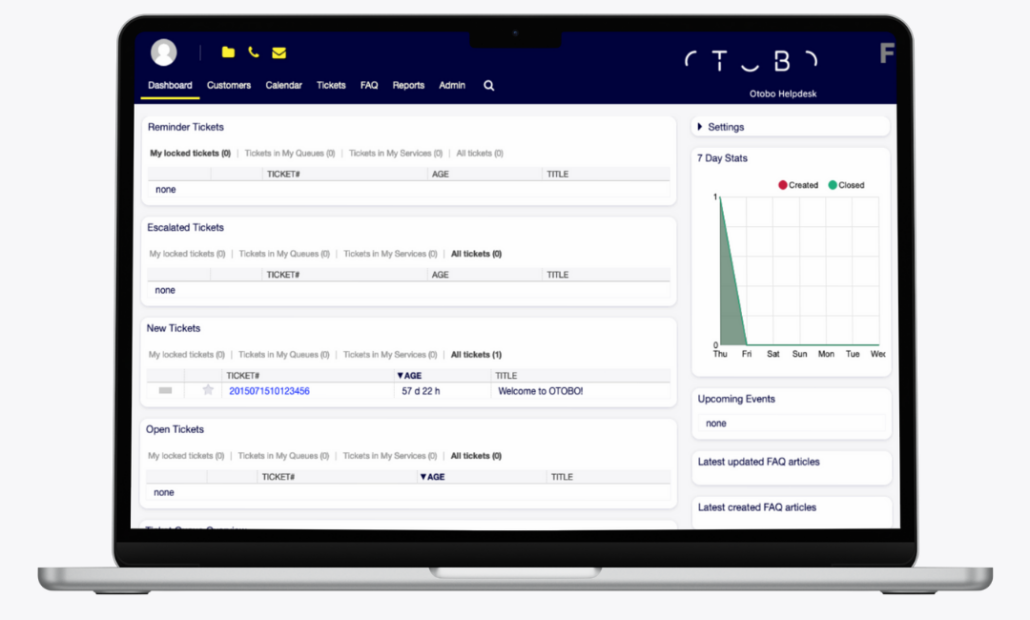
The customizable dashboard serves as the central overview page for your service agents. With the dashboard, service staff and the responsible service desk manager stay informed about key trends, escalated tickets, upcoming activities, and metrics to manage the performance of the service team and service desks.

Using individually configurable widgets, you can tailor the dashboard to the team’s needs with ticket lists, calendar views & events, report statistics, and news. Each widget can be easily moved within the dashboard using drag & drop.
Dashboard and Reporting | OTOBO 1

Customizable widgets

  • Reminder Tickets

    Tickets set to be waiting for processing by an agent at a later time, meaning there is a reminder period in progress.

  • Escalated Tickets

    Tickets escalate after the expiration of the escalation time defined in an SLA and therefore require immediate attention.

  • New Tickets

    Tickets that have not yet been processed by an agent.

  • Open Tickets

    Open tickets represent the current activities of the agents.

  • Active Process Tickets

    Here, all started but not yet completed process tickets are visible.

  • Ticket Queue Overview

    The overview provides transparency regarding the number of tickets per queue depending on their status.

  • Ticket Event Calendar

    The widget displays tickets in a calendar view.

  • Upcoming Events

    Entries from the calendar are displayed, such as major changes or maintenance windows.

  • Appointments

    All appointments for today, tomorrow, and the current week.

  • 7-day statistics

    Informs about the number of tickets created and closed in the last seven days.

  • Out of Office overview

    An overview of all colleagues who are currently unavailable and have stated this in their personal profile settings.

  • Recently created & modified FAQ articles

    Recently created and recently modified FAQ articles, very helpful in current problem situations.

  • Logged-in users

    The widget displays the currently logged-in agents and customers.

  • News

    News – displays news from an RSS feed.

Filter the results to see all tickets you have access to, those you have locked, or those in your queues. Need more widgets? Contact us.

OpenStreetMap integration

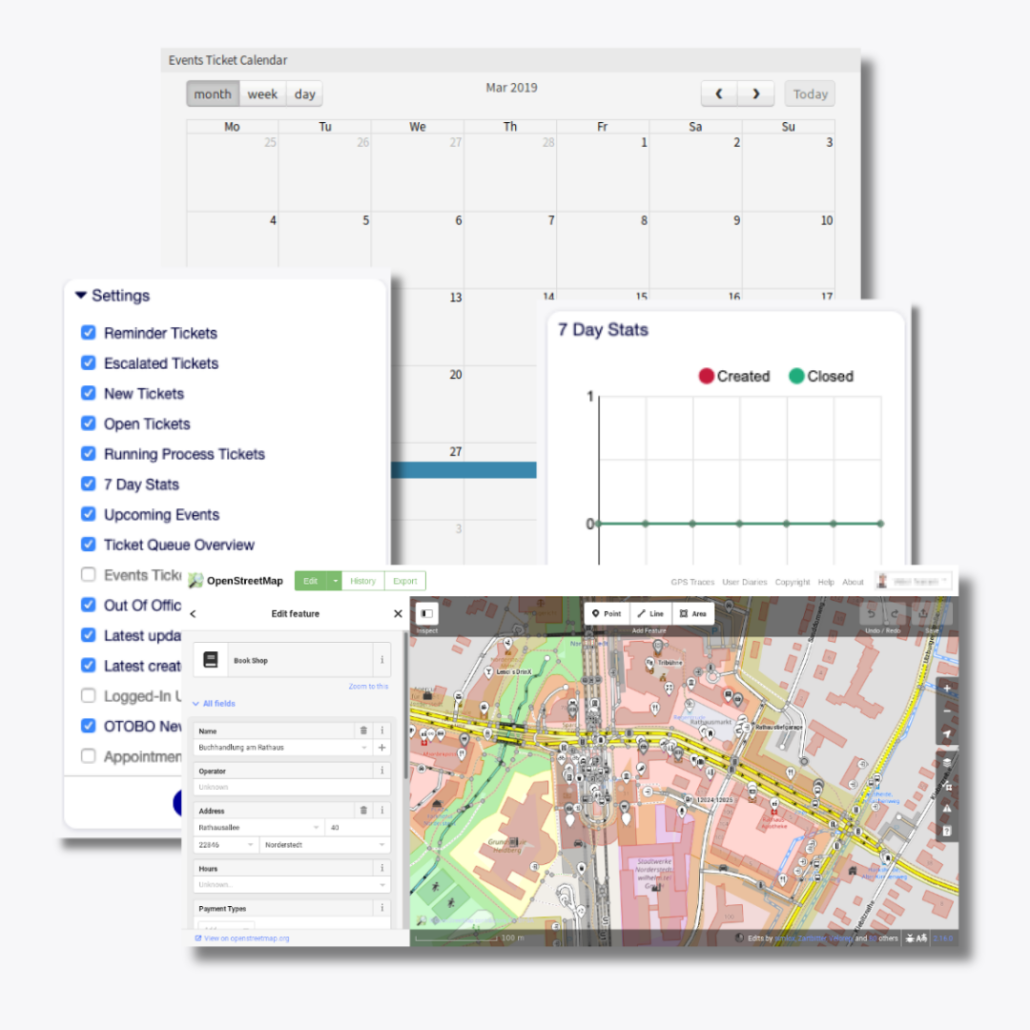
Display the locations of your branches, data centers, or offices on a map to support your team or field service. Optionally, you can also represent the location and linkage of assets (Configuration Items (CIs) within the map, making connections between your resources visible at a glance and color-coding the status of individual objects.

You can optionally make the map available as a dashboard widget or as a dedicated map on a separate page, for example, to display it in a situation center on a separate monitor and provide an overview of the status of managed systems at a glance.

The advantage of OpenStreetMap over Google Maps: You don’t have privacy issues.
Dashboard and Reporting | OTOBO 2
Dashboard and Reporting | OTOBO 3

Create and automatically send reports

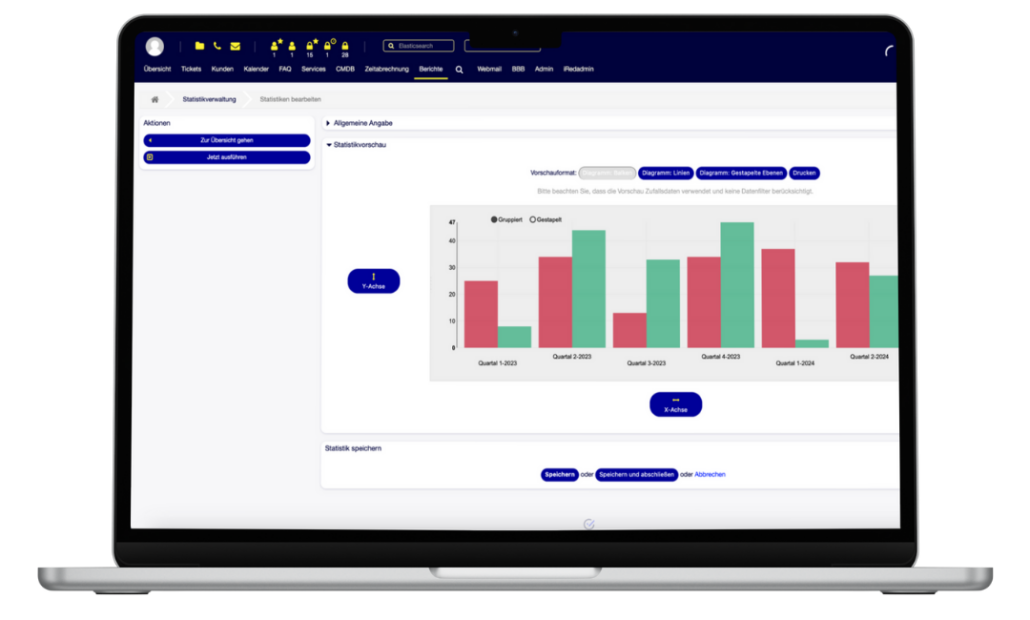
Generate evaluations for individual metrics, combine them into meaningful reports, or display tabular or graphical analyses as widgets on the dashboard. All settings are configurable; no programming knowledge is required.

Send your reports as PDF documents to a list of recipients via email at pre-defined time intervals.

CSAT, NPS – Ask your customers how satisfied they are

Ensure customer satisfaction by directly asking your customers. With OTOBO, you can create new surveys or edit existing ones, and activate them to be sent to customers after closing tickets.

The evaluation can be presented in aggregated form, while also allowing you to view detailed responses.
Dashboard and Reporting | OTOBO 4

Dashboard and Reporting | OTOBO 5

SCALABLE PLATFORM

Continuously improve performance and service quality

IT Service Management (ITSM)

Dashboard and Reporting | OTOBO 6

With selected Service Desk Analytics, you keep real-time track of all essential trends and metrics, the performance of the ITSM team, and the entire IT service desk. You meet your SLAs – employees and customers are satisfied.

➞ Additional ITSM capabilities

Customer Service Management (CSM)

Dashboard and Reporting | OTOBO 7

Optimize customer support planning based on transparent real-time reports. Gain clarity on which areas are causing ticket congestion, how self-service is performing, and whether your service agents’ response times meet SLA agreements.

➞ Additional CSM capabilities

Enterprise Service Management (ESM)

Dashboard and Reporting | OTOBO 8

Keep an eye not only on your own Service Level Agreements (SLAs) but also on the Operational Level Agreements (OLAs) with internal teams and Underpinning Contracts (UCs) with external service providers. And all in real-time for the entire organization, centrally orchestrated in a unified platform.

➞ Additional ESM capabilities

SERVICE EXCELLENCE

Ready to take the next step